Skills, traits, living reviews, and (some) geographical psychology.
Who am I?
What I do
- SEB skills
- Measurement
- Change goals
- Learning and achievement
- Methodology
- Meta-research
- Psychometrics
- Statistical methods
- Geographical psychology
Today’s presentation
- SEB skills
- What they are and what they are not
- Definition
- Structure
- Assessment
- Current results
- My Living review project
- What they are and what they are not
- Some geographical psychology (or ‘why am I here?’)
Soft skills
“Noncognitive skills, a construct that nearly everyone can agree is important but no one can agree on how to measure.” (Harden, 2021).
A definition
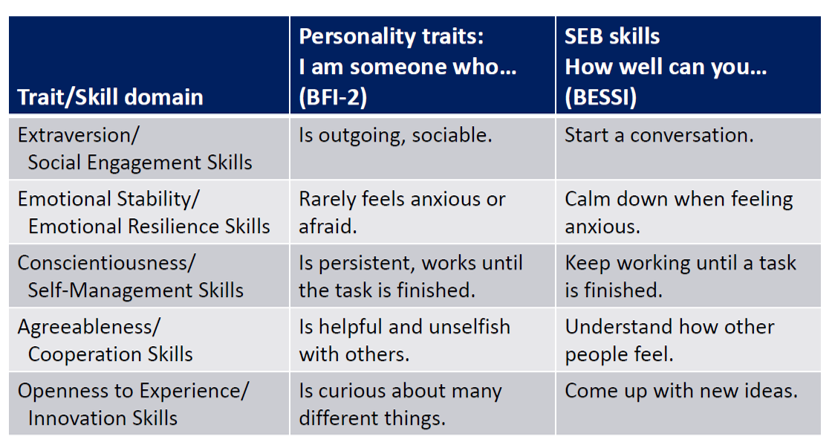
Personality traits represent characteristics patterns of thinking, feeling, and behaving.
What someone tends to do across situations.
SEB skills represent functional capacities to establish and maintain social relationships, regulate emotions, and effectively manage behaviors toward goals and learning11.
What someone can do when the situation calls for it.
Traits and skills levels can be congruent or discrepant. For instance, an introvert might be able to (at least in some cases) act as a leader or efficiently speak in public.
Structure
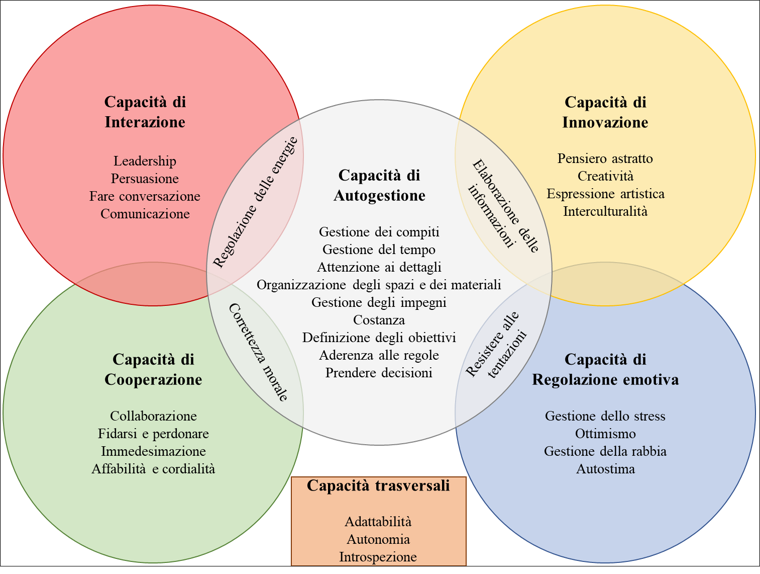
SEB skills mainly fall into five areas11,12 that resemble the Big Five.
Conscientiousness
Extraversion
Agreeableness
Openness
Emotional stability
- Self-management skills
- Social engagement skills
- Cooperation skills
- Innovation skills
- Emotional resilience skills
These domains clearly parallel the Big Five in terms of their cognitive, affective, and behavioral referents.
Measurement: The BESSI
This approach is designed to better align the measurement method with the construct being assessed.
The SEB model
What we know about SEB skills
SEB skills predict achievement
- At school
- At work
SEB domains have differential predictive power
Skill-trait mismatches predict well-being
Changes in SEB predict changes in outcomes
Laypeople see changing skills as desirable
Changing skills perceived easier than changing traits
Especially for teachers!
It seems actually possible and more feasible to change skills
Rationale
Replication crisis, QRPs…what’s the future like for new frameworks?
State of the things
New opportunities
- We finally have a new integrative and systematic framework
- This framework offers a new measurement tool that should better measure skills
- This framework allows for a distinction between skills and traits
Old problems
It is hard to remain up-to-date with the literature
Meta-analysis and reviews are static, slow, and specific
Emerging fields are rapidly growing with pros, cons, and possible ‘conflicts of interests’
HOW CAN WE MAKE THIS NEW LINE OF RESEARCH TRULY RELIABLE, ACCESSIBLE, AND CUMULATIVE?
The idea
We need a way to keep track of new publications -> just create a database!
But that changes daily! -> …update it
And then? -> Code and analyze everything!
How? -> By yourself…or we’ll find a way to help you
A living systematic review and meta-analysis: By creating an adaptable infrastructure for evidence integration, we hope to support more transparent, efficient, and rigorous scientific progress.
Structures and aims
Three core rationales:
Prevent fragmentation
Enable timely integration
Advance open science
Three main aims:
- Review aim: provide a living, organized cartography of SEB literature, freely accessible and filterable;
- Meta-analytic aim: continually synthesize (cross-sectional) associations between SEB skills and all other constructs and variables measured alongside;
- Open science aim: open materials and the Living SEB App to enable replication, rapid evidence checks, preregistration support, and community contributions.
Method
see preregistration
Search strategy (WOS + Scopus)
| Database | String |
|---|---|
| Scopus |
|
| Web Of Science |
|
Outcomes
This review is not limited to any outcome, but all possible outcomes will be coded and included. Outcomes will be treated in the following way:
Broad category: Each outcome is assigned to the a broad category. Examples might be skills, mental health, school, demographic variables, job, personality traits…
Second-level category: Subsequently, within each broad category, each outcome is assigned to a more specific category. For instance, the broad ‘traits’ category may include the big five, hexaco, character strengths. School may include academic achievement, learning factors.
Specific construct: Finally, each construct is labeled with its own construct label (e.g., extraversion, self-management).
Meta-analytic methods
Only cross-sectional data (now)
Three-level models for correlation coefficients
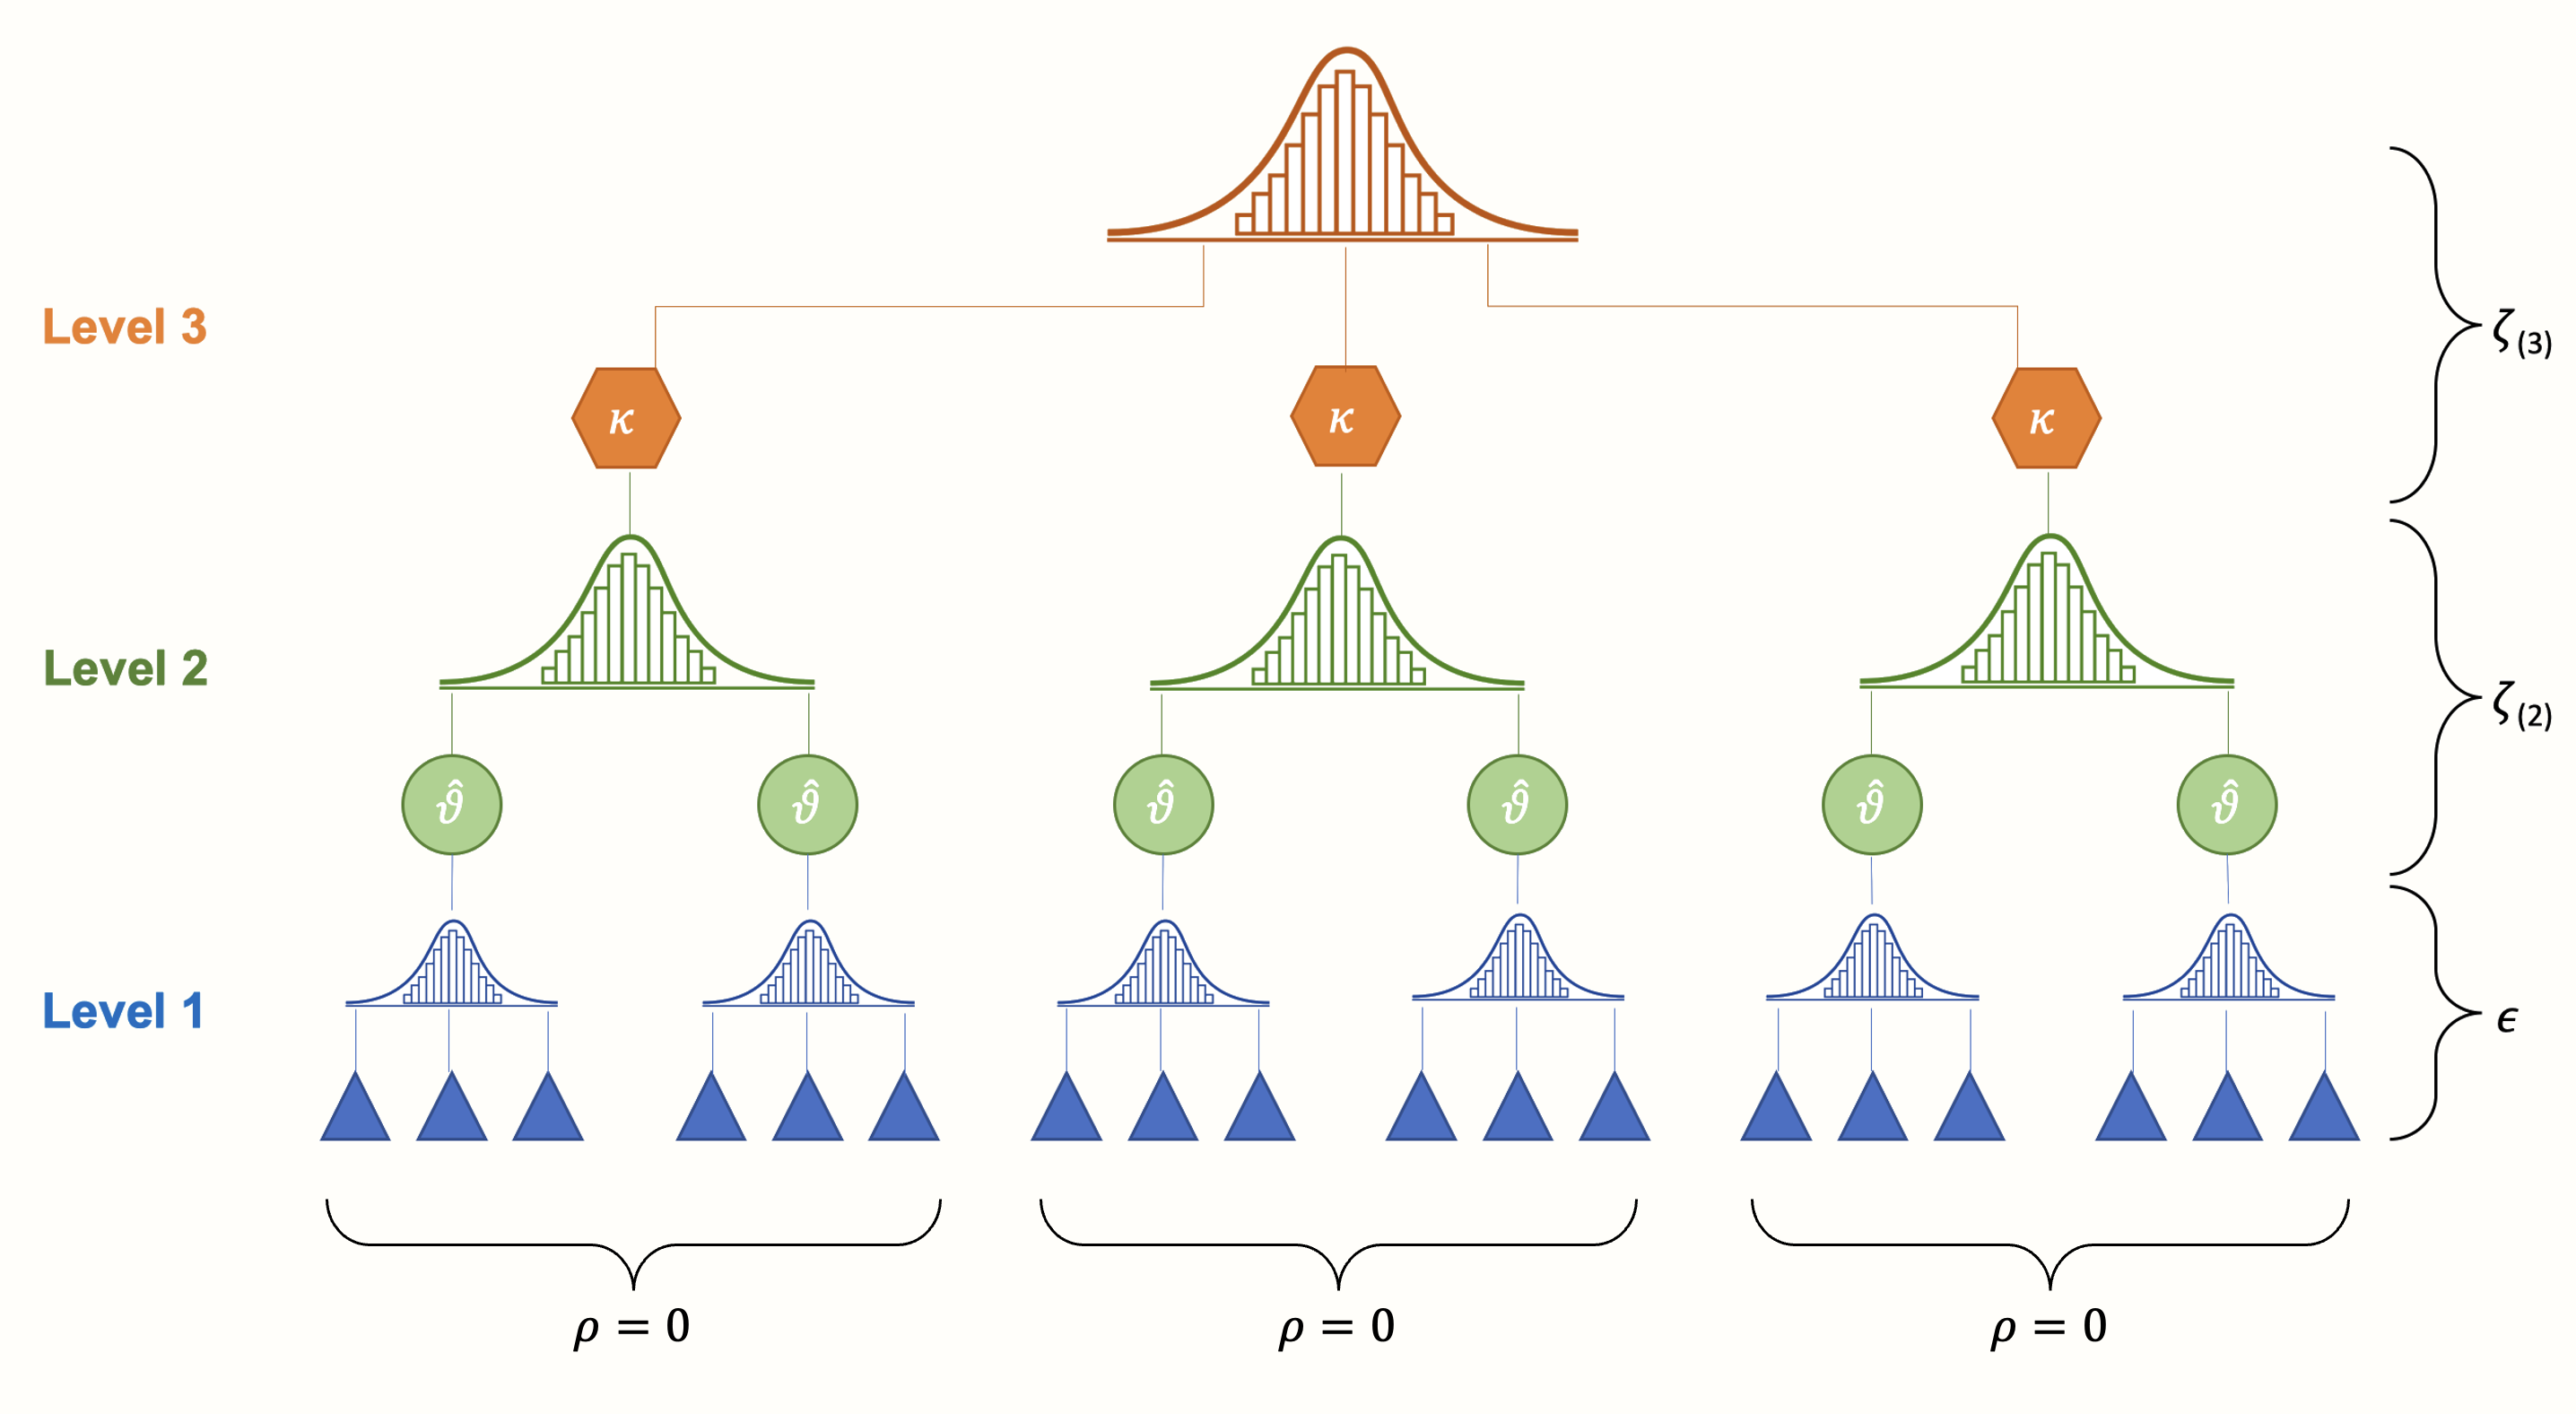
Meta-SEM for pooled correlations and ‘advanced’ multivariate analyses
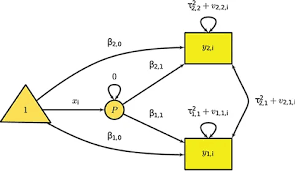
Do SEB skills predict (correlate with) academic achievement?
Temporary results
Database
In general
- Records identified: 259
- Records for review: 26
- Records for meta-analysis: 14
- 21 samples
- 137-5075 participants per sample (med = 702)
- 14.599 correlations (SEB = 12.235)
- 5232 unique associations (SEB = 3518)
With achievement
- Meta-analysis of correlations:
- Studies: 7
- Samples: 8
- Effects: 40
- Median N = 868 (350-5075)
- Meta-SEM
- Studies: 13
- Samples: 20
- Effects: 3-19
- Ns: 2712-20763
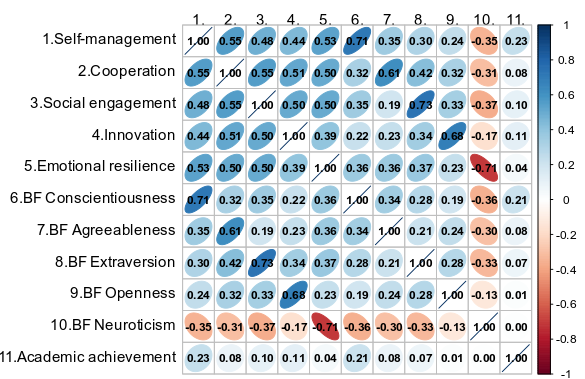
Associations
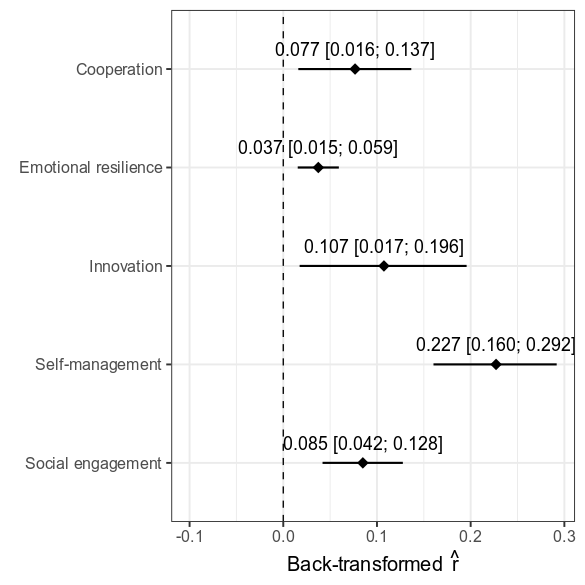
Pooled correlations
Incremental validity
| Domain | Trait | Skill |
|---|---|---|
| Openness - Innovation | 0.21 [-170; 170] | -0.15 [-213;213] |
| Conscientiousness - Selfmanagement | 0.08 [-0.01; 0.17] | 0.17 [0.07; 0.27] |
| Extraversion - Socialengagement | -0.02 [-260; 260] | 0.10 [-285: 285] |
| Agreeableness - Cooperation | 0.05 [-0.02; 0.12] | 0.04 [-0.02; 0.11] |
| Neuroticism - Emotional resilience | 0.07 [0.03; 0.12] | 0.05 [0.00; 0.11] |
Some convergence issues but…
Don’t you trust me?
Try it yourself: https://feracoshiny.shinyapps.io/livingSEBapp/
Next steps
Finalize the app
Possibly find a way to add modules for future development
Longitudinal / intervention data
Non-correlational designs
Add features for other-uploaded data
More?
Socio-ecological perspectives on school anxiety
Variability in school anxiety
As far as I know, fine grained spatial variability of students’ characteristics has not been study yet. Generally, large international data collections focus on cross-country variability, ignoring within-country variability.
For instance, school anxiety effects seem to vary across continents and countries with adjusted effects that happen to be even positive18!
Research questions
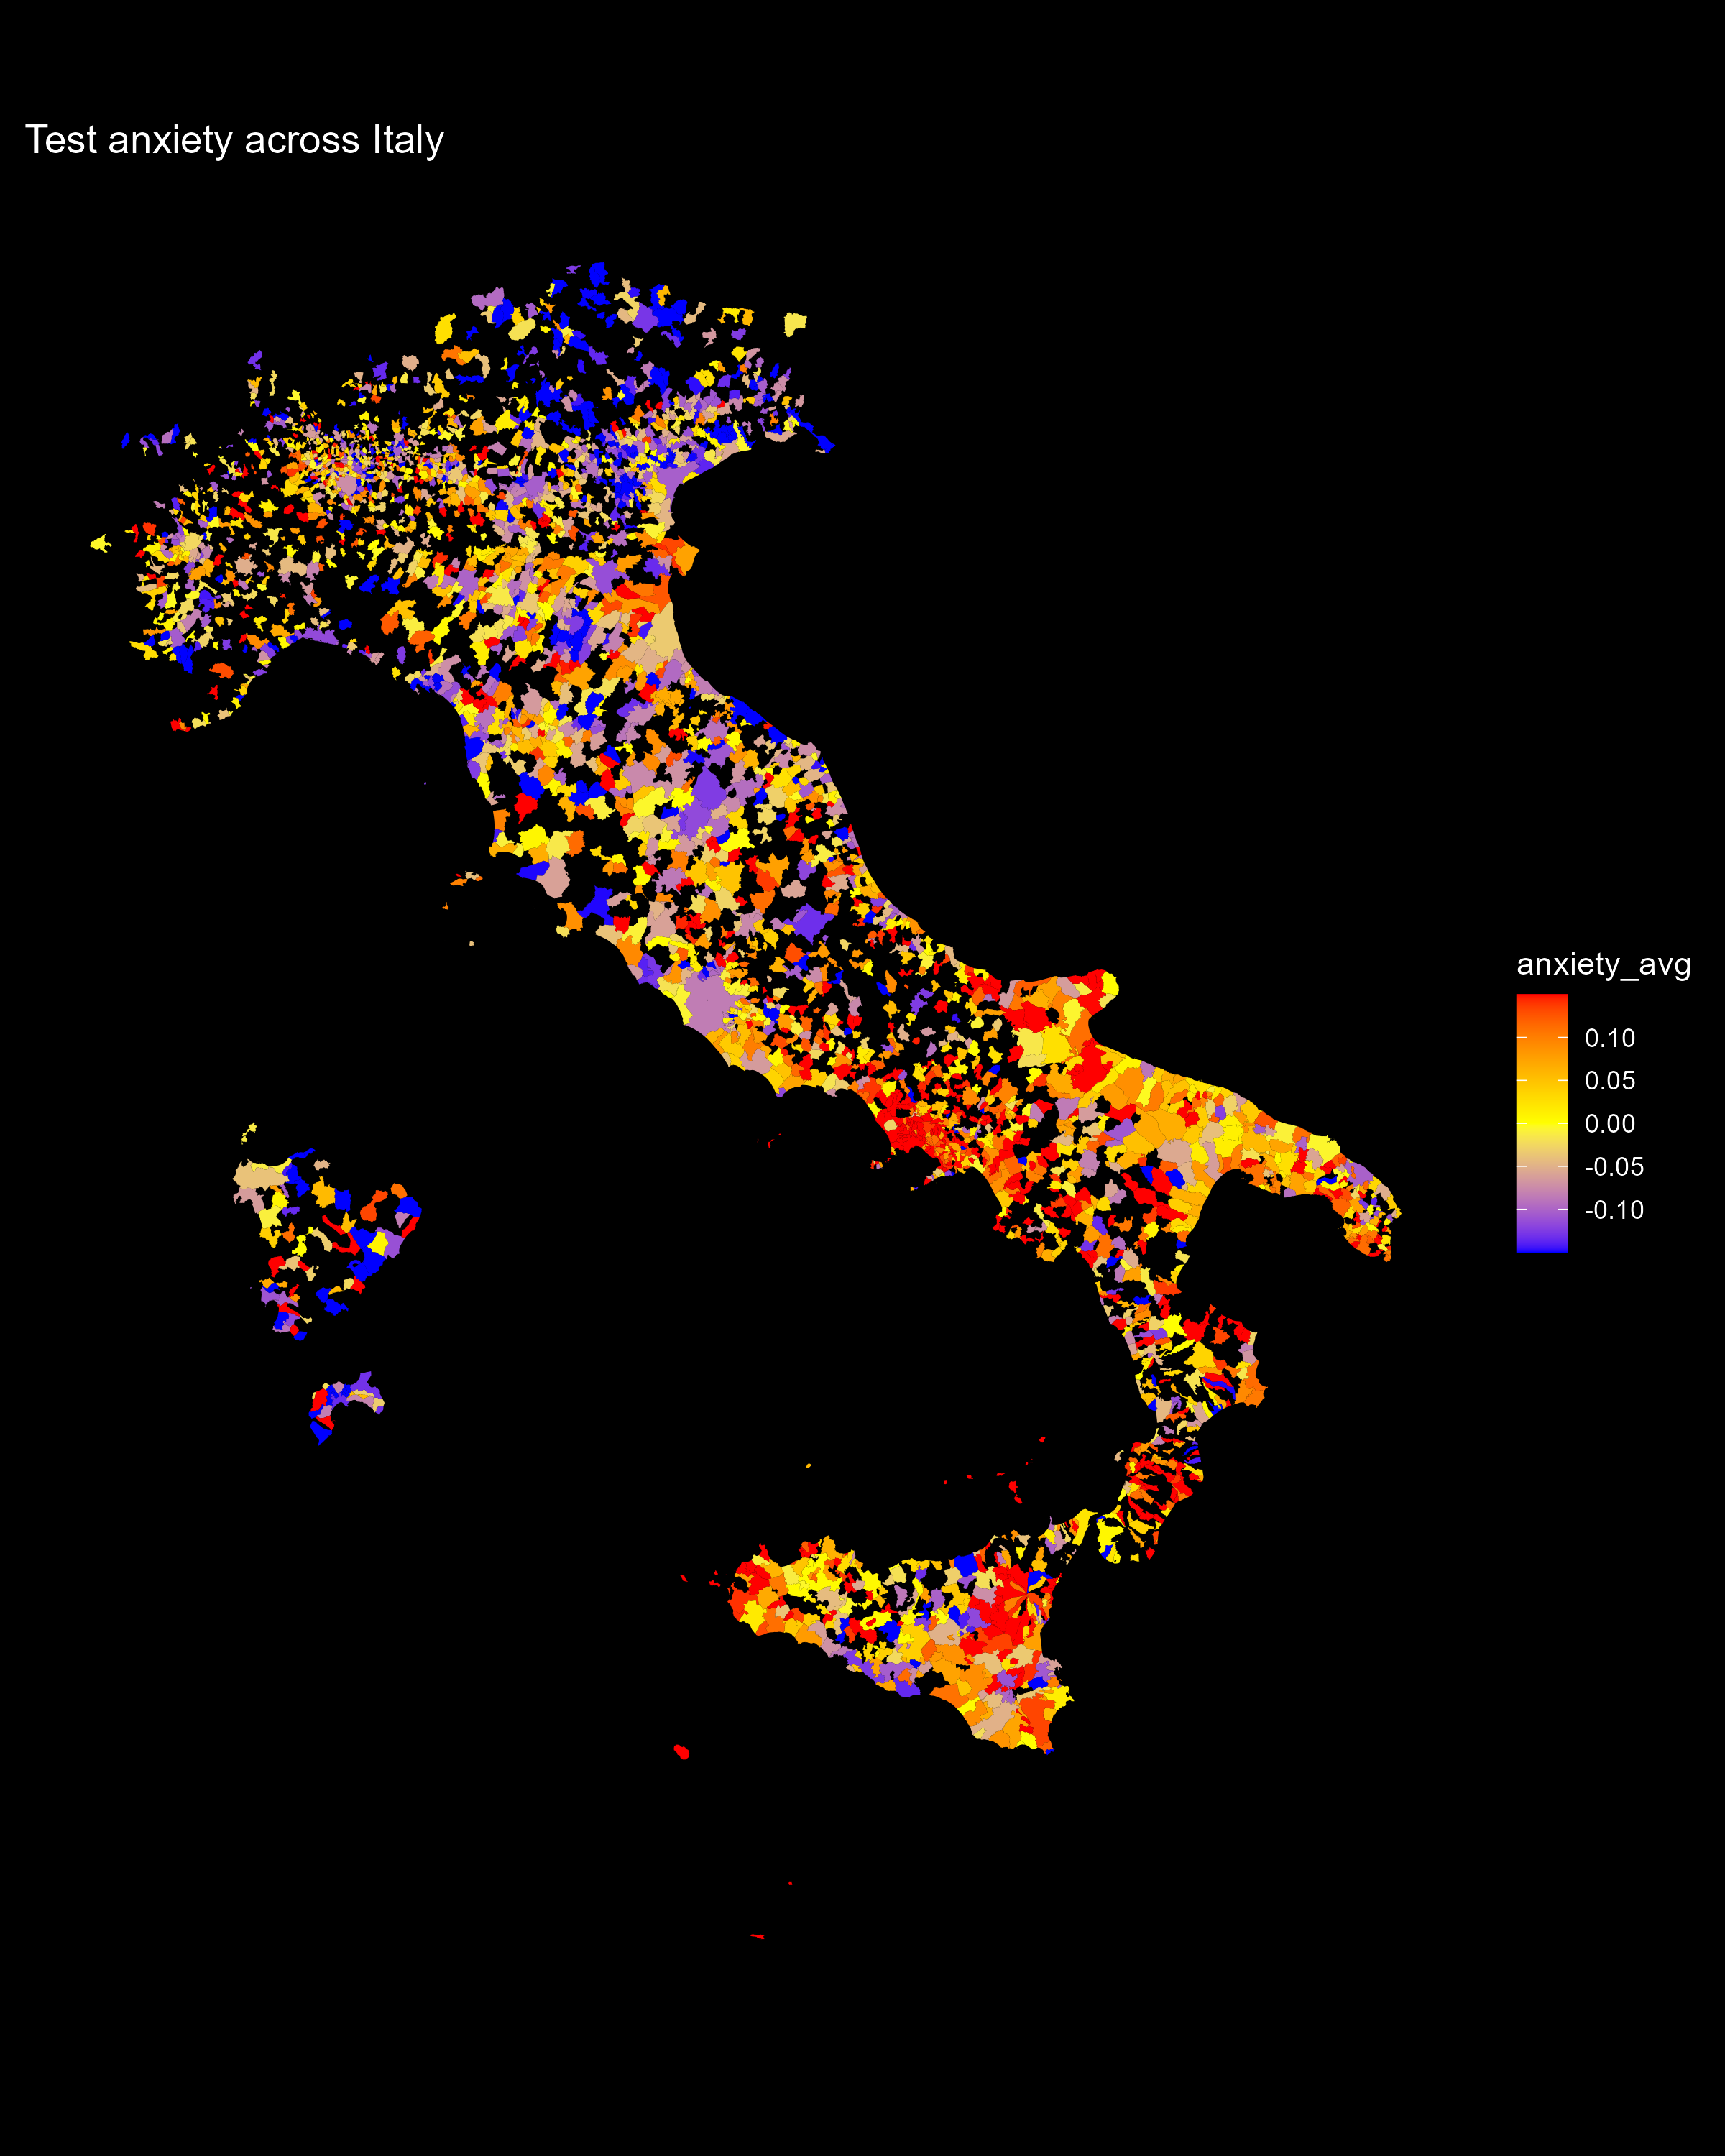
Does test anxiety vary across Italian municipalities?
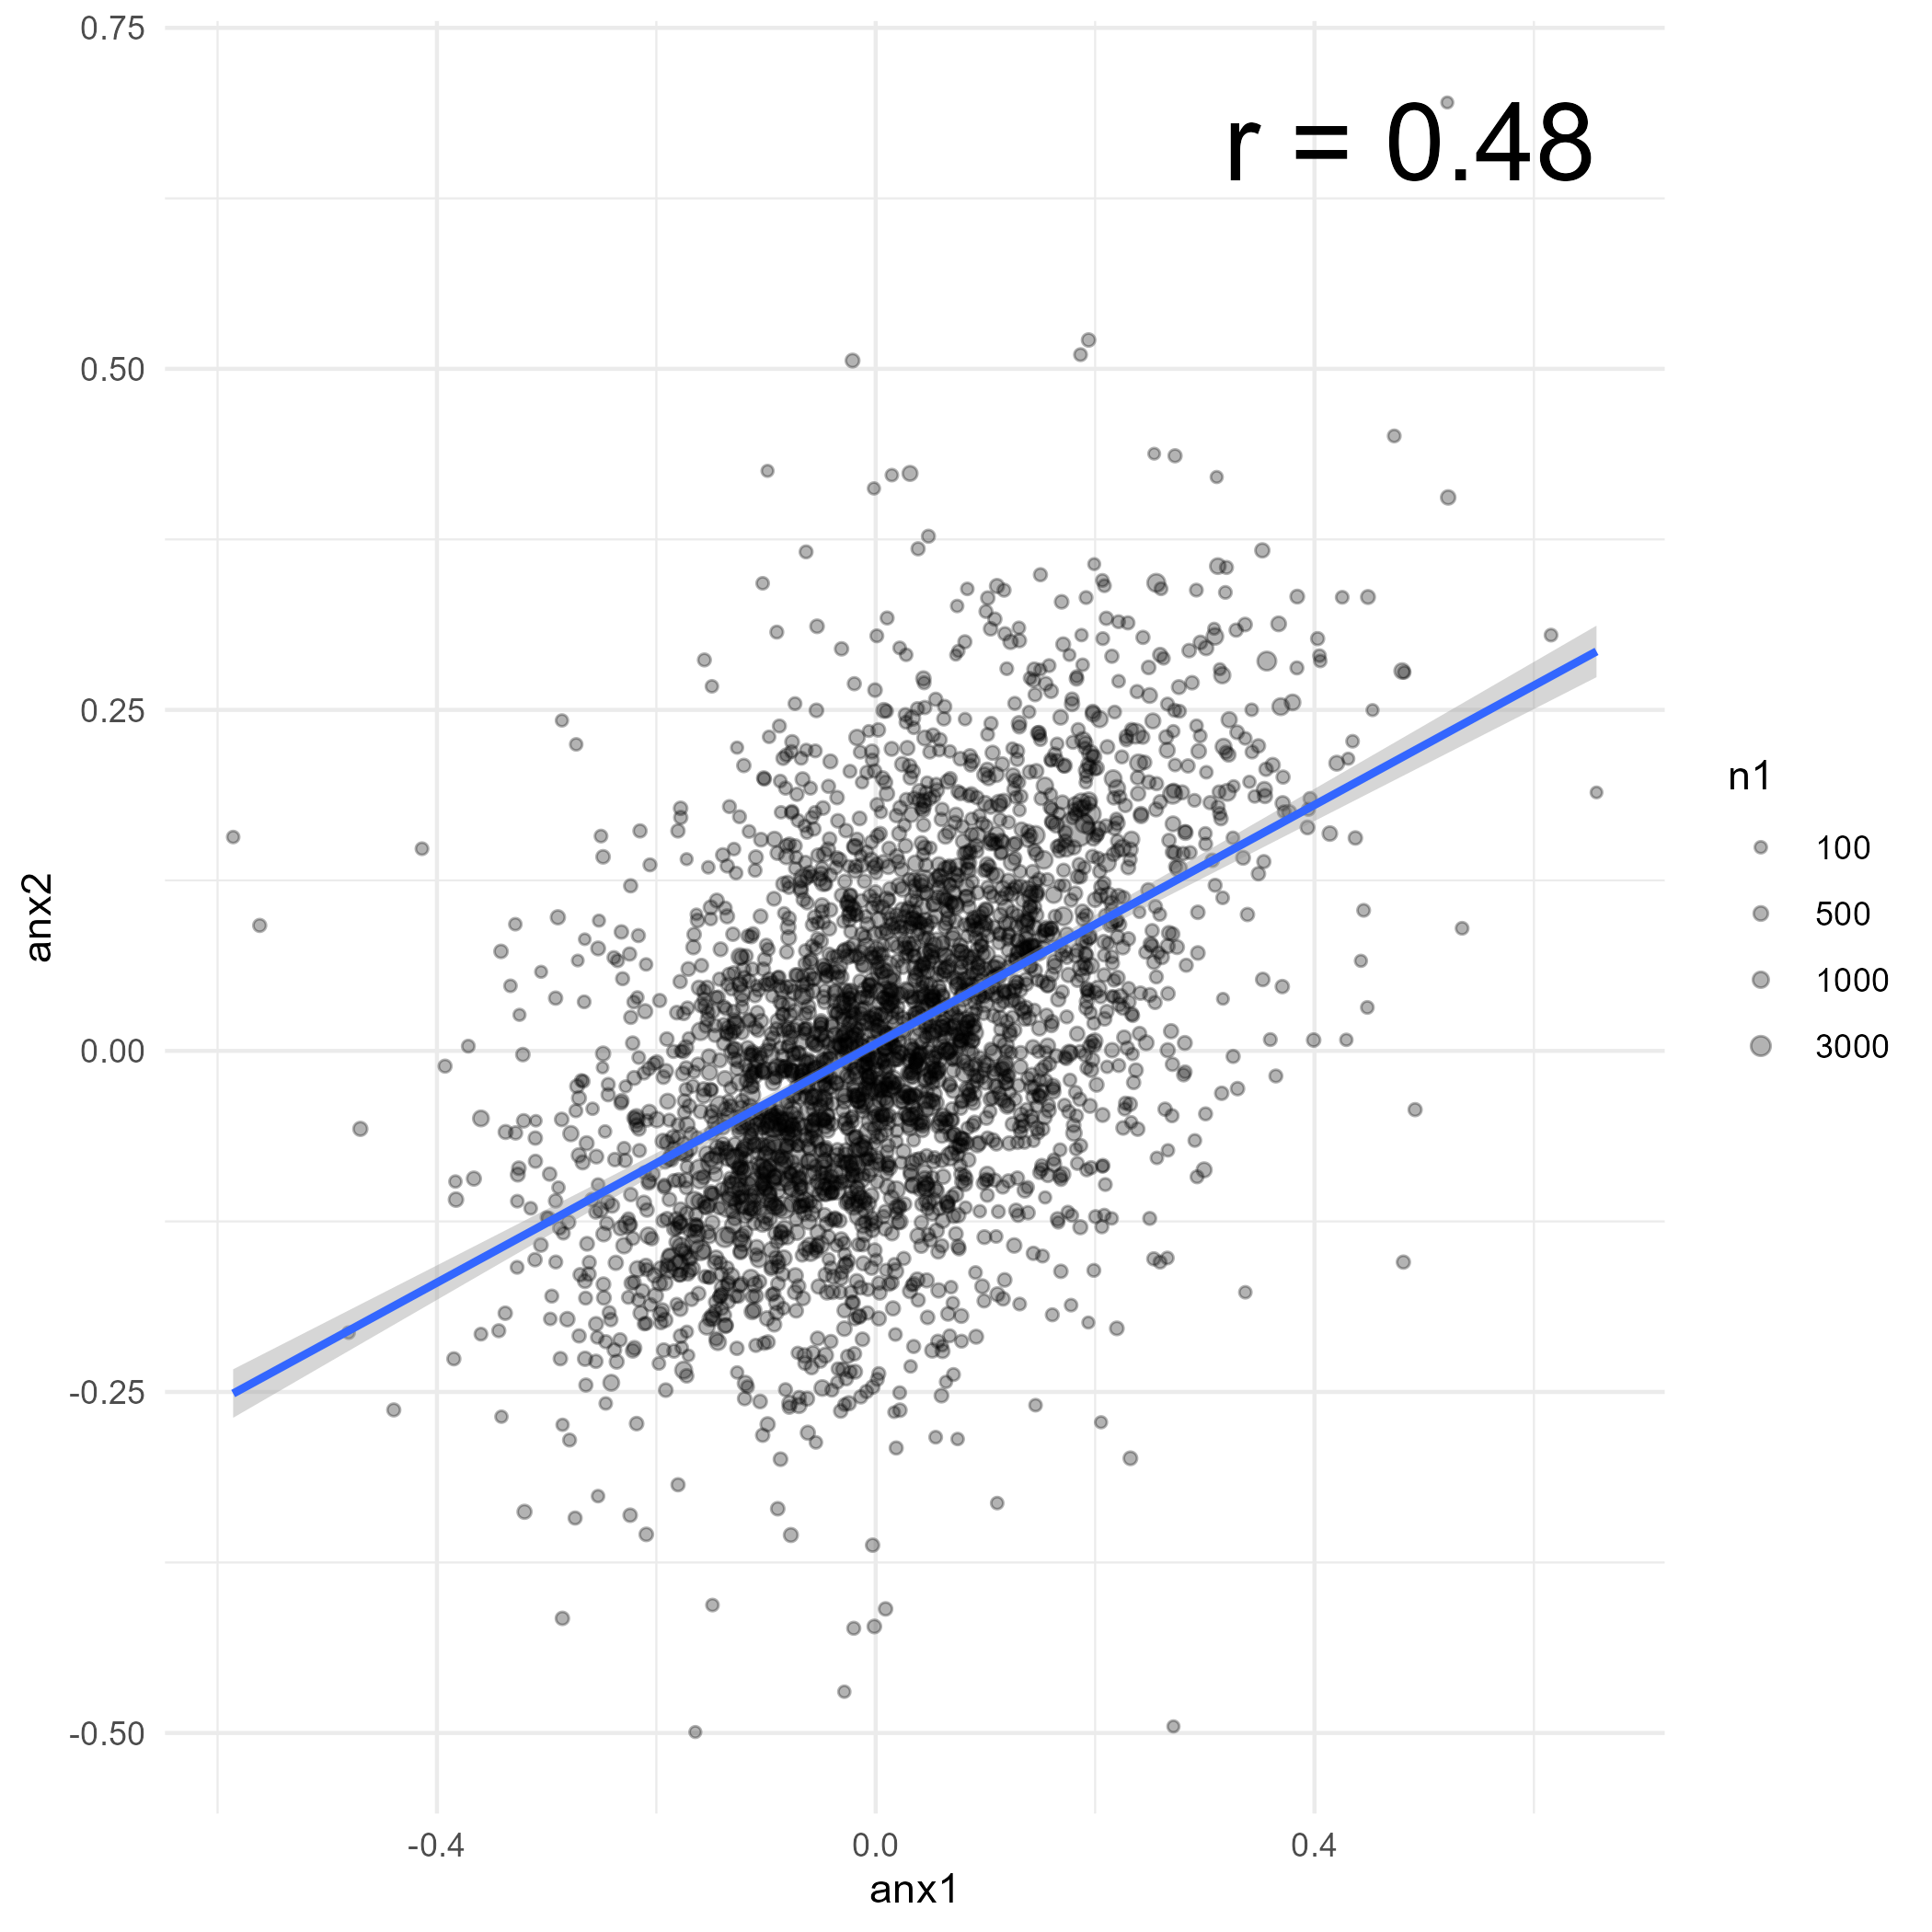
How stable are these differences across time?
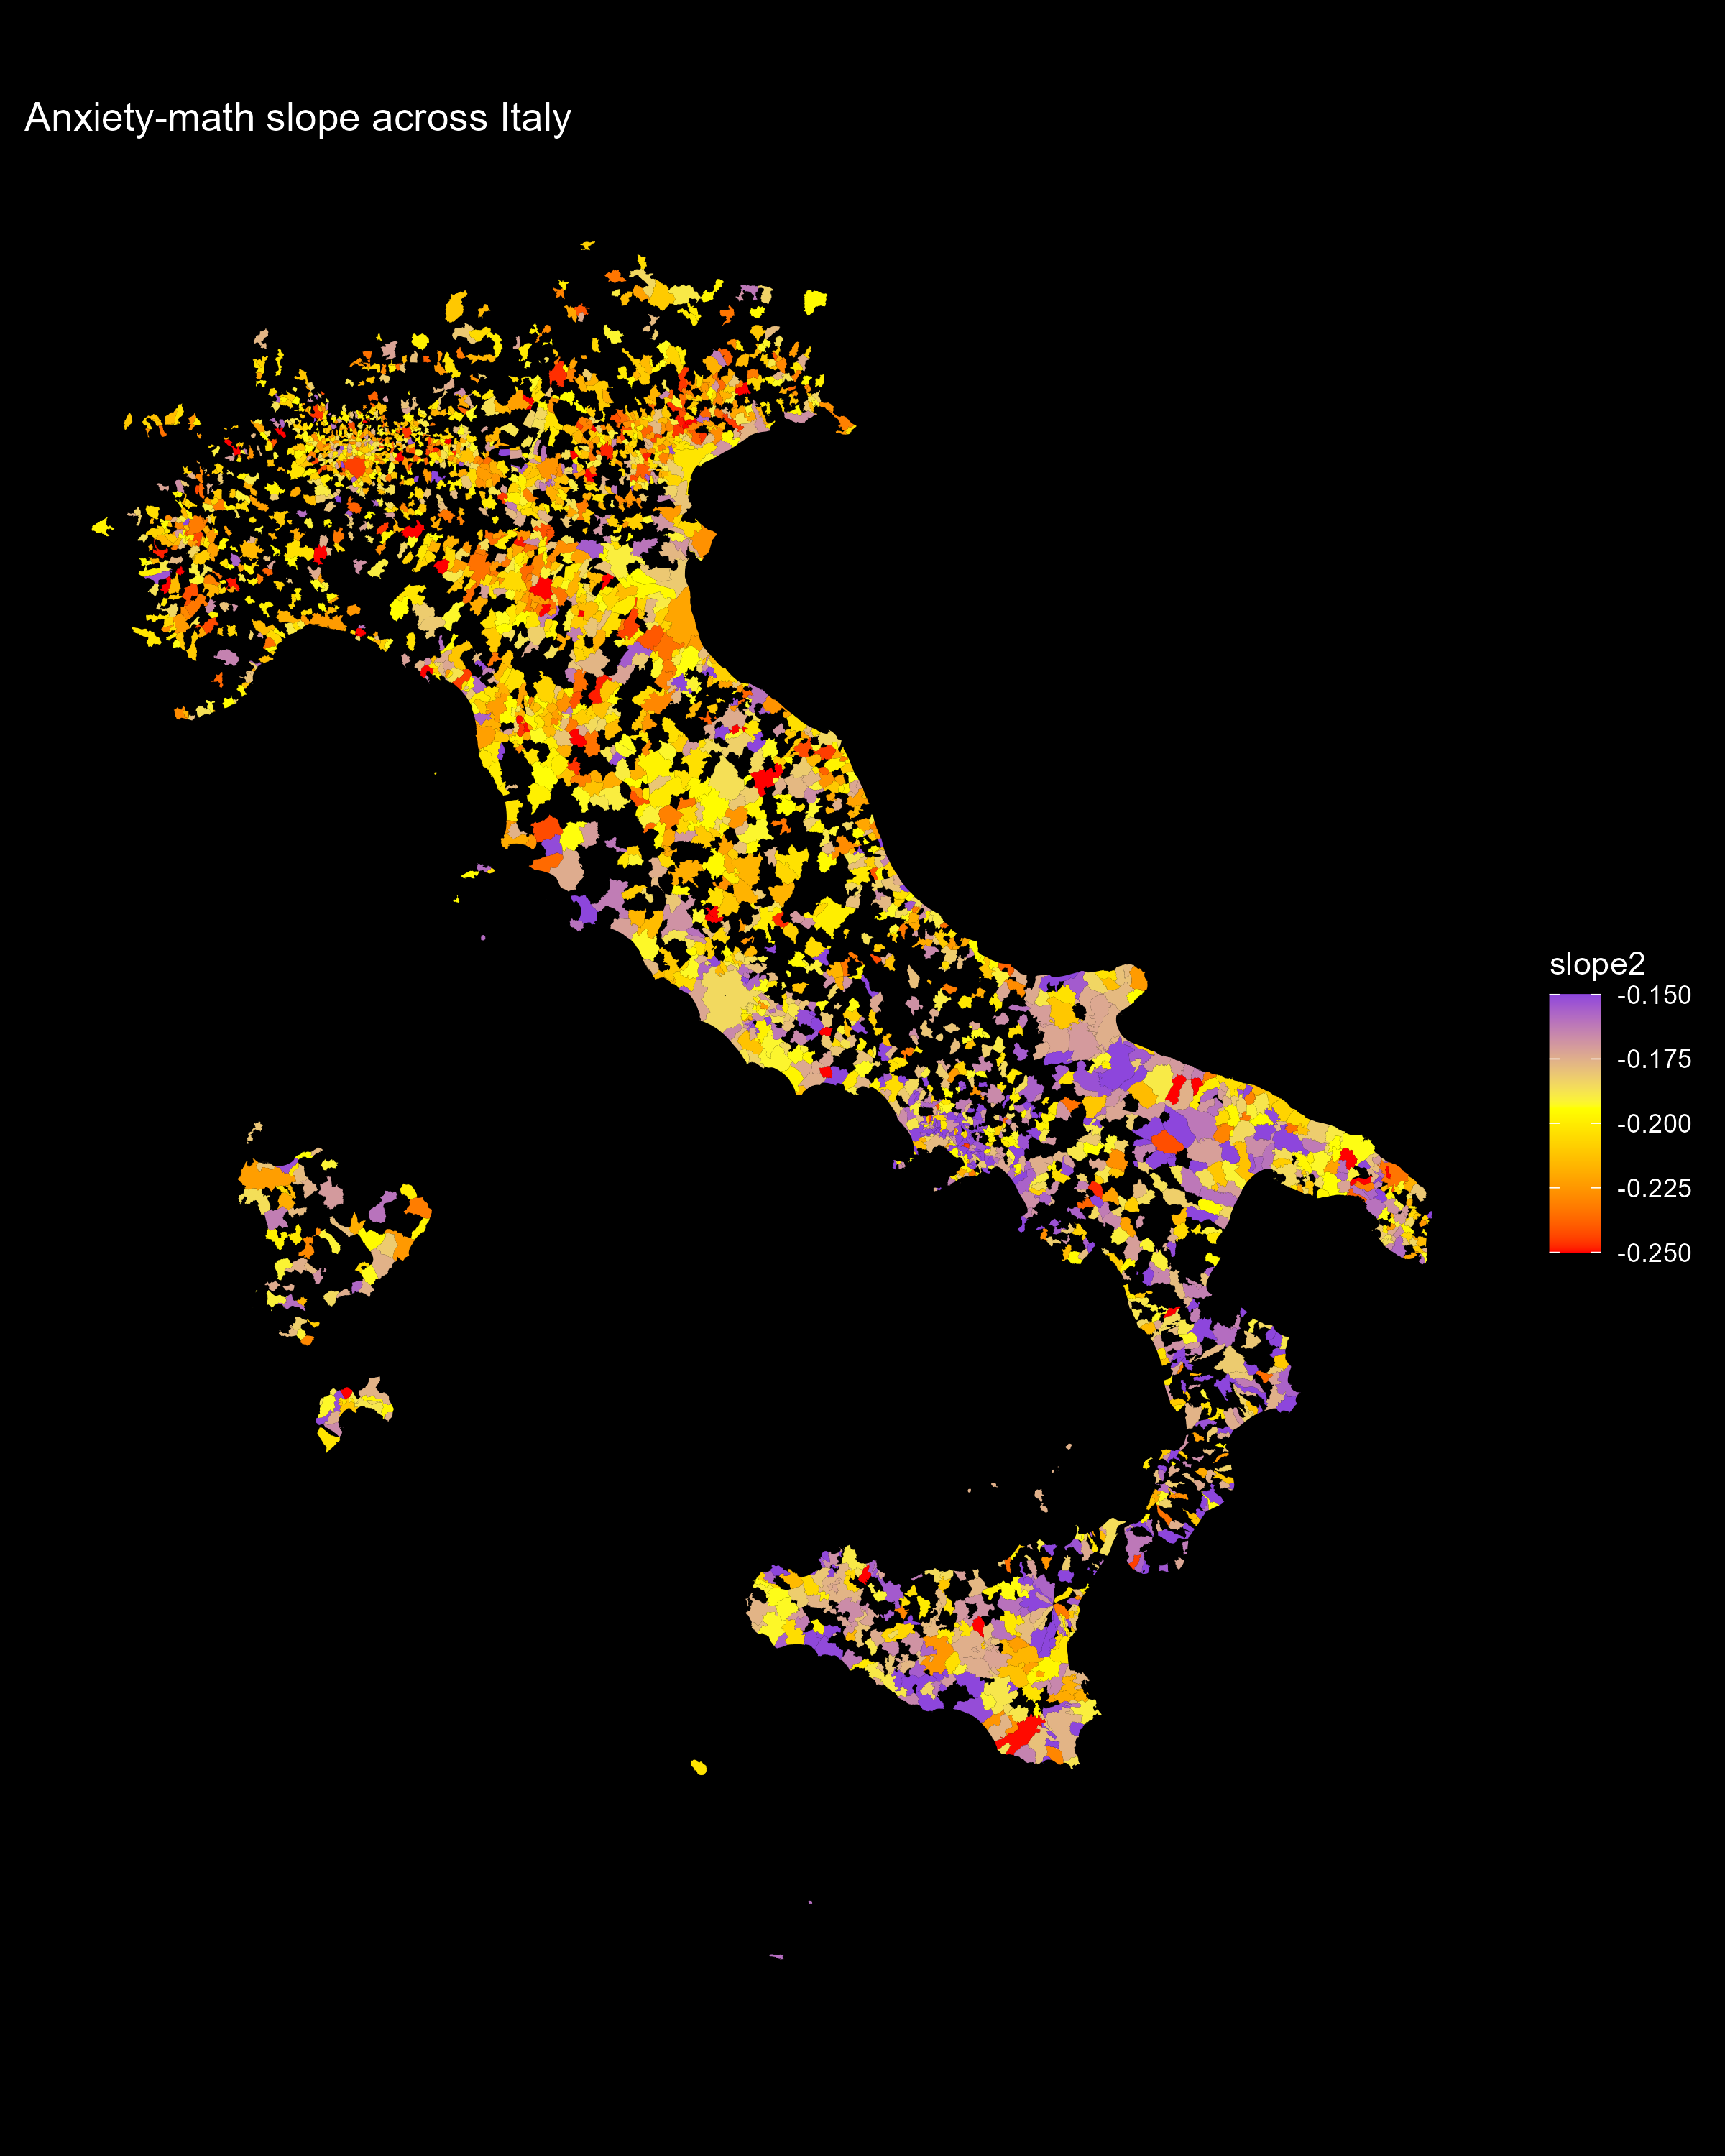
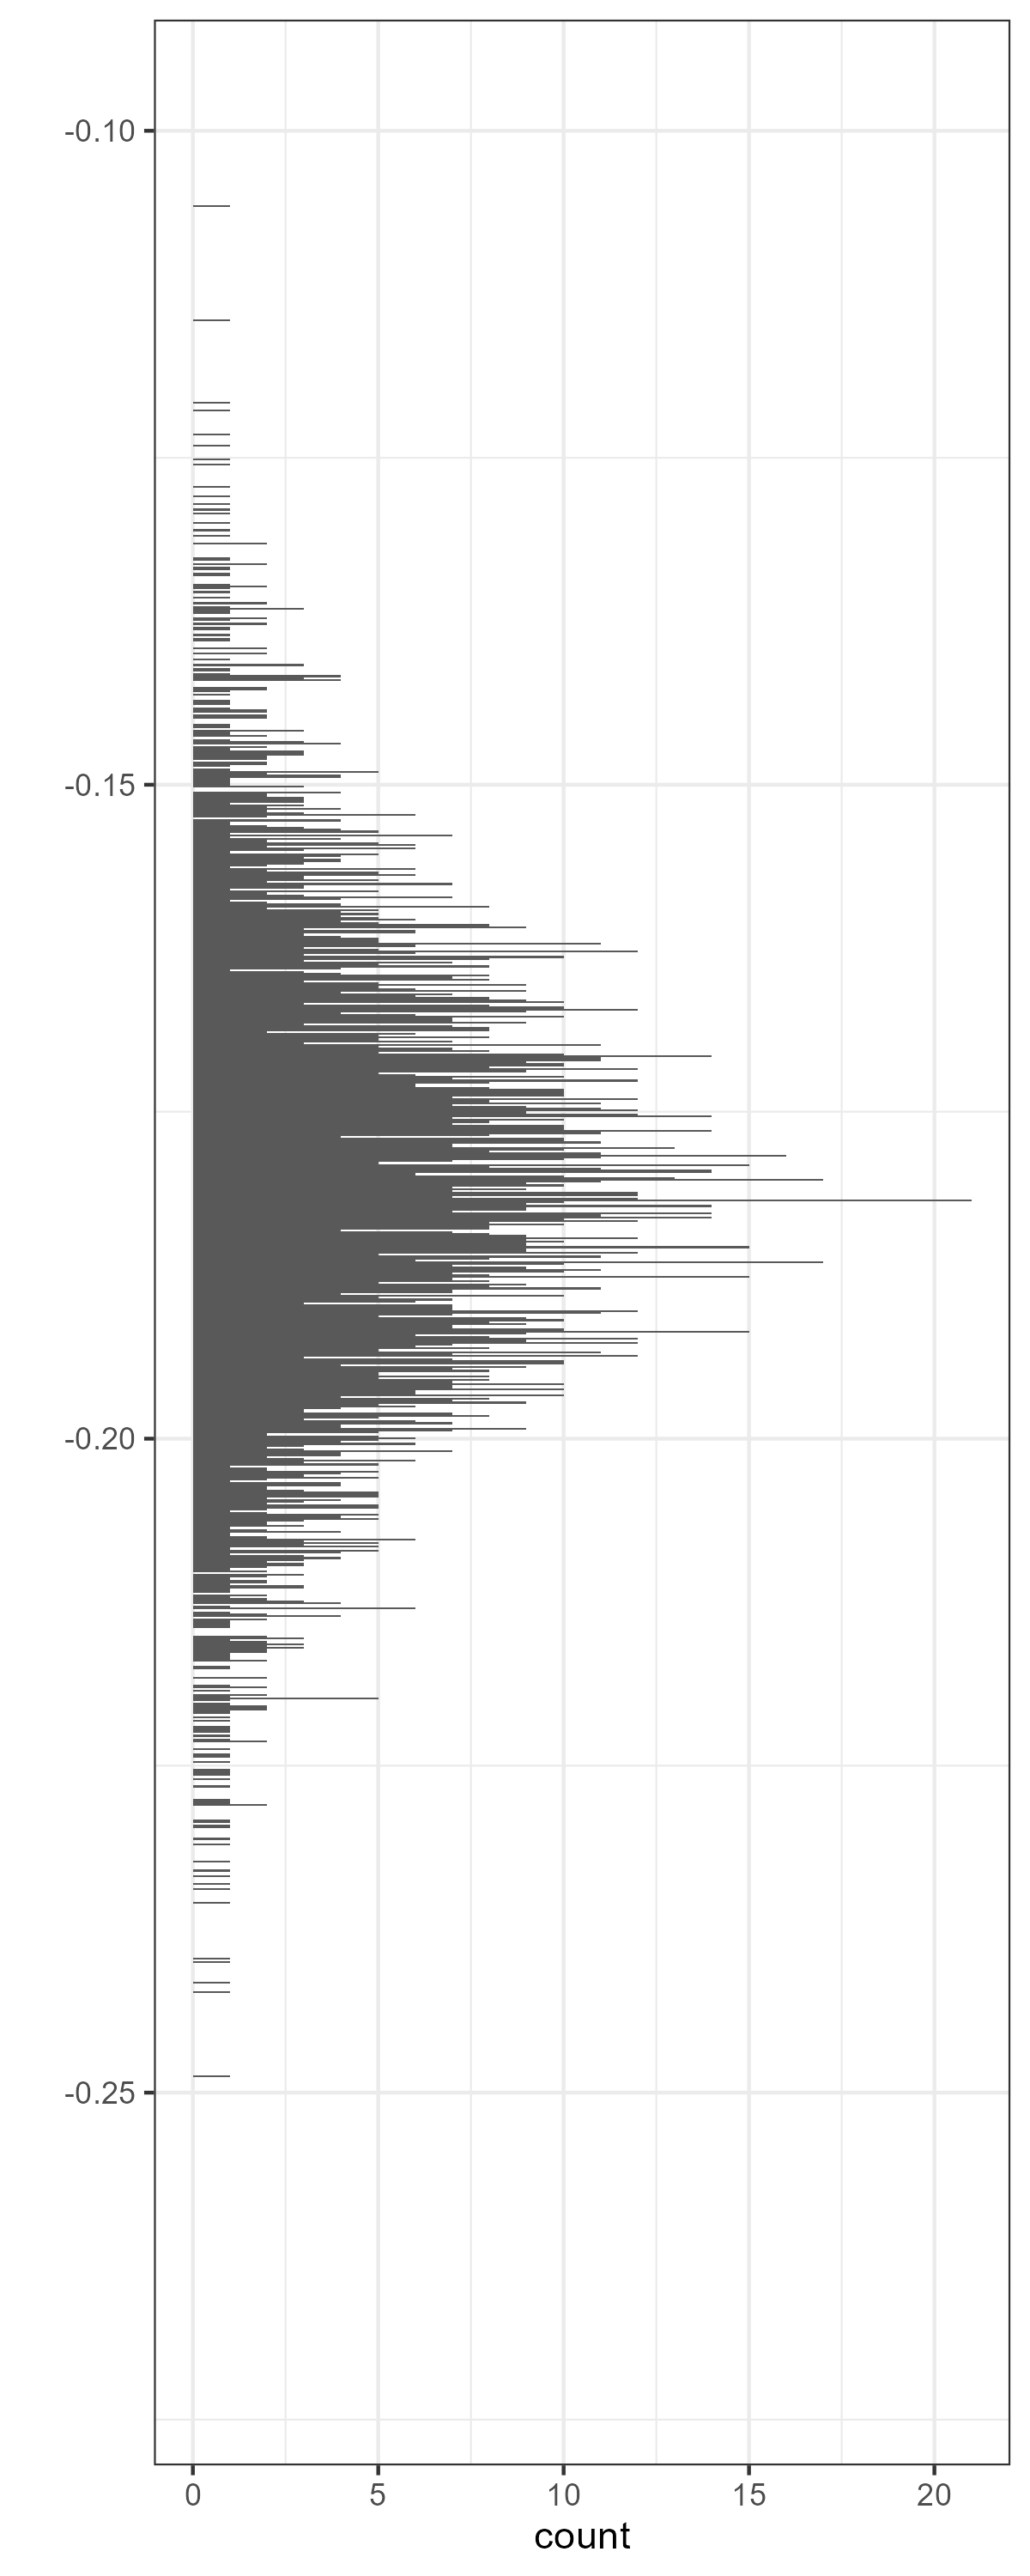
Does the association between test anxiety and math and reading skills vary across Italian municipalities?
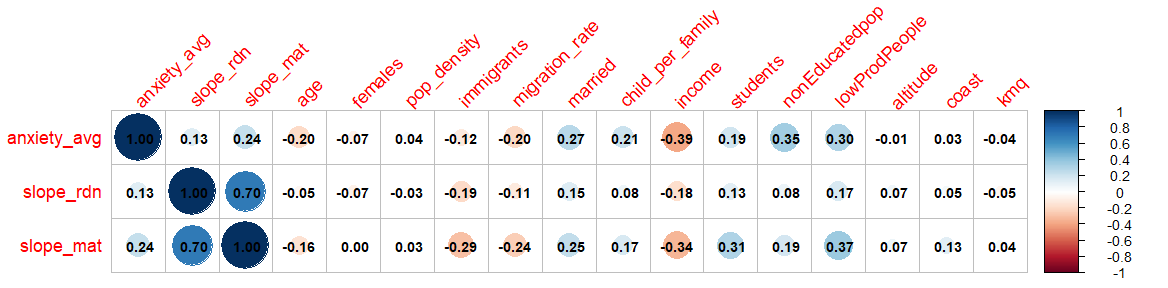
To what extent do municipalities` key socio-ecological characteristics (e.g., demographic, social, economic, and natural geographic features) relate to this variation?
Methods
The INVALSI dataset: INVALSI yearly collects data from all Italian schools. Data from 5th graders collected between 2012/2013 and 2017/2018 (six cohorts of the entire Italian 5th graders population; 3/5 million students).
Test anxiety
Math achievement
Reading achievement
Municipalities: ~3.000 municipalities (Italy has ~7.000)
demographic (age, gender, population density)
social (immigrants share, migration rates, married couples, children)
economic (income, education, job levels)
natural geographic features (altitude, coasts, kmq)
Preliminary results - average anxiety
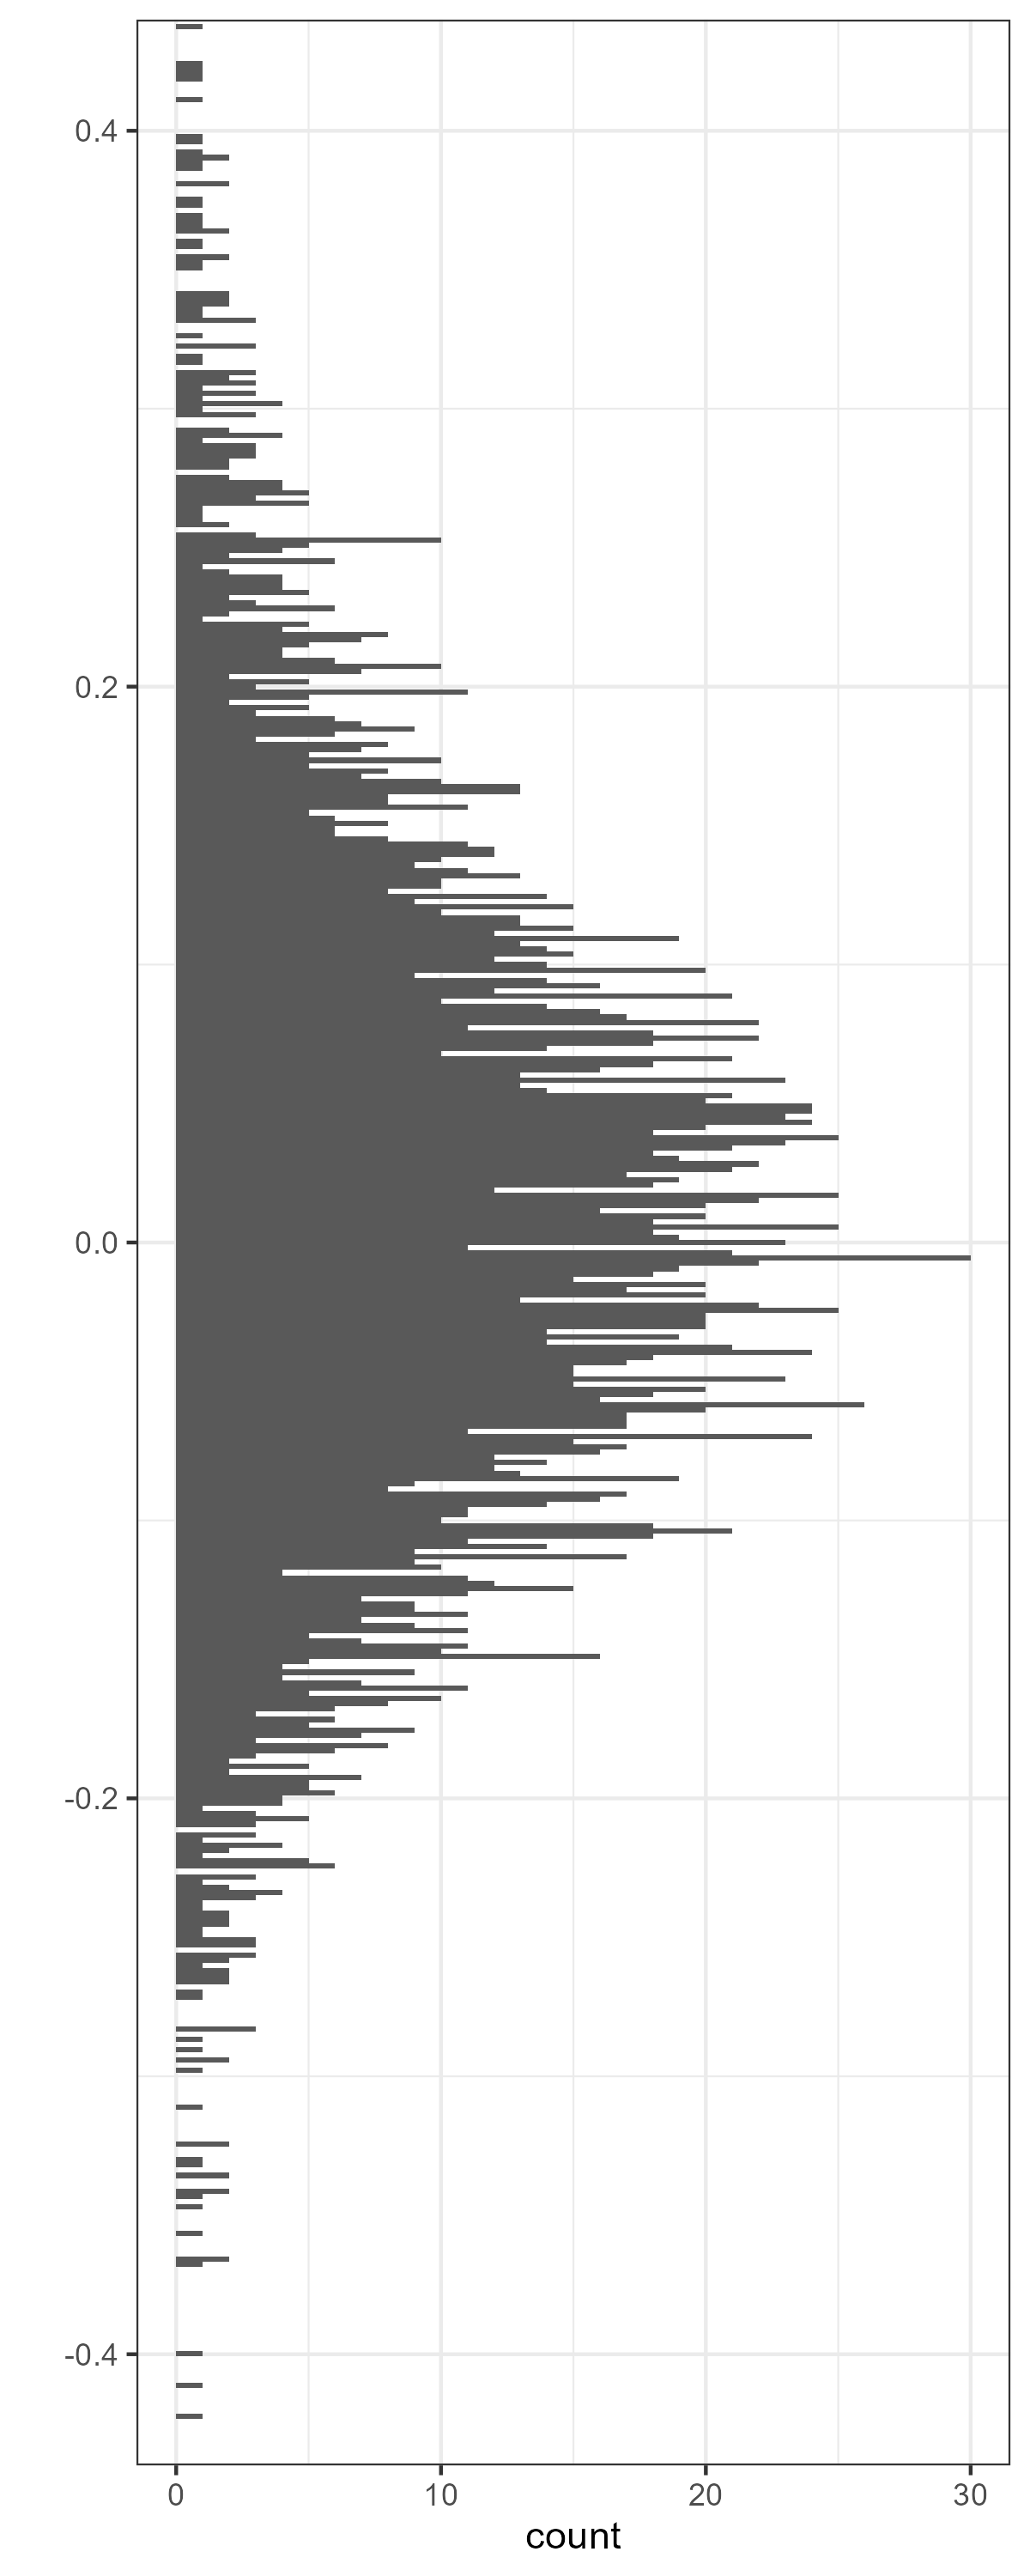
Preliminary results - consistency
Preliminary results - math slopes
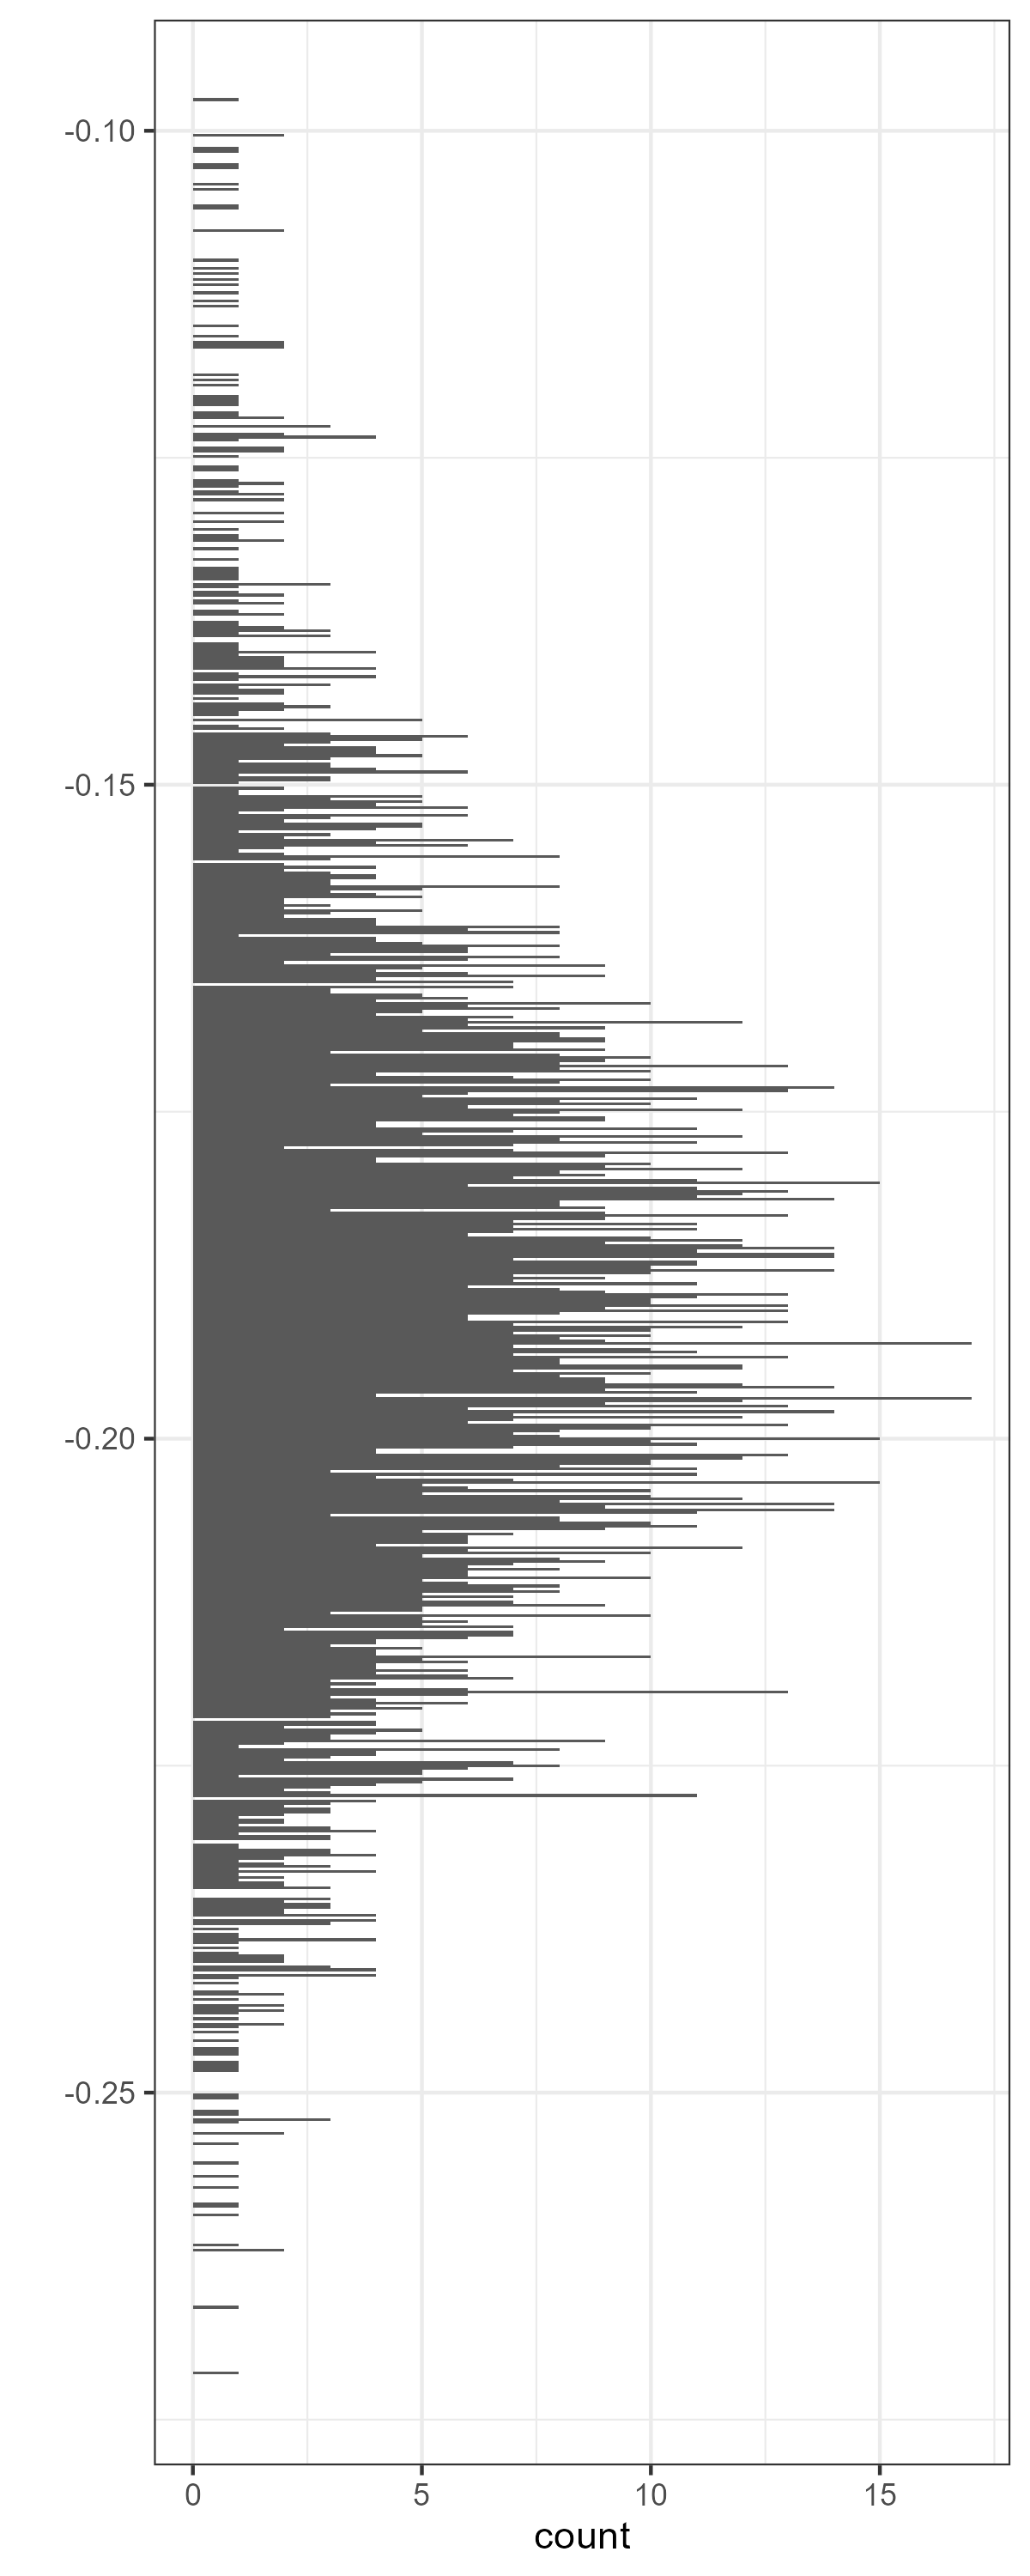
Preliminary results - reading slopes
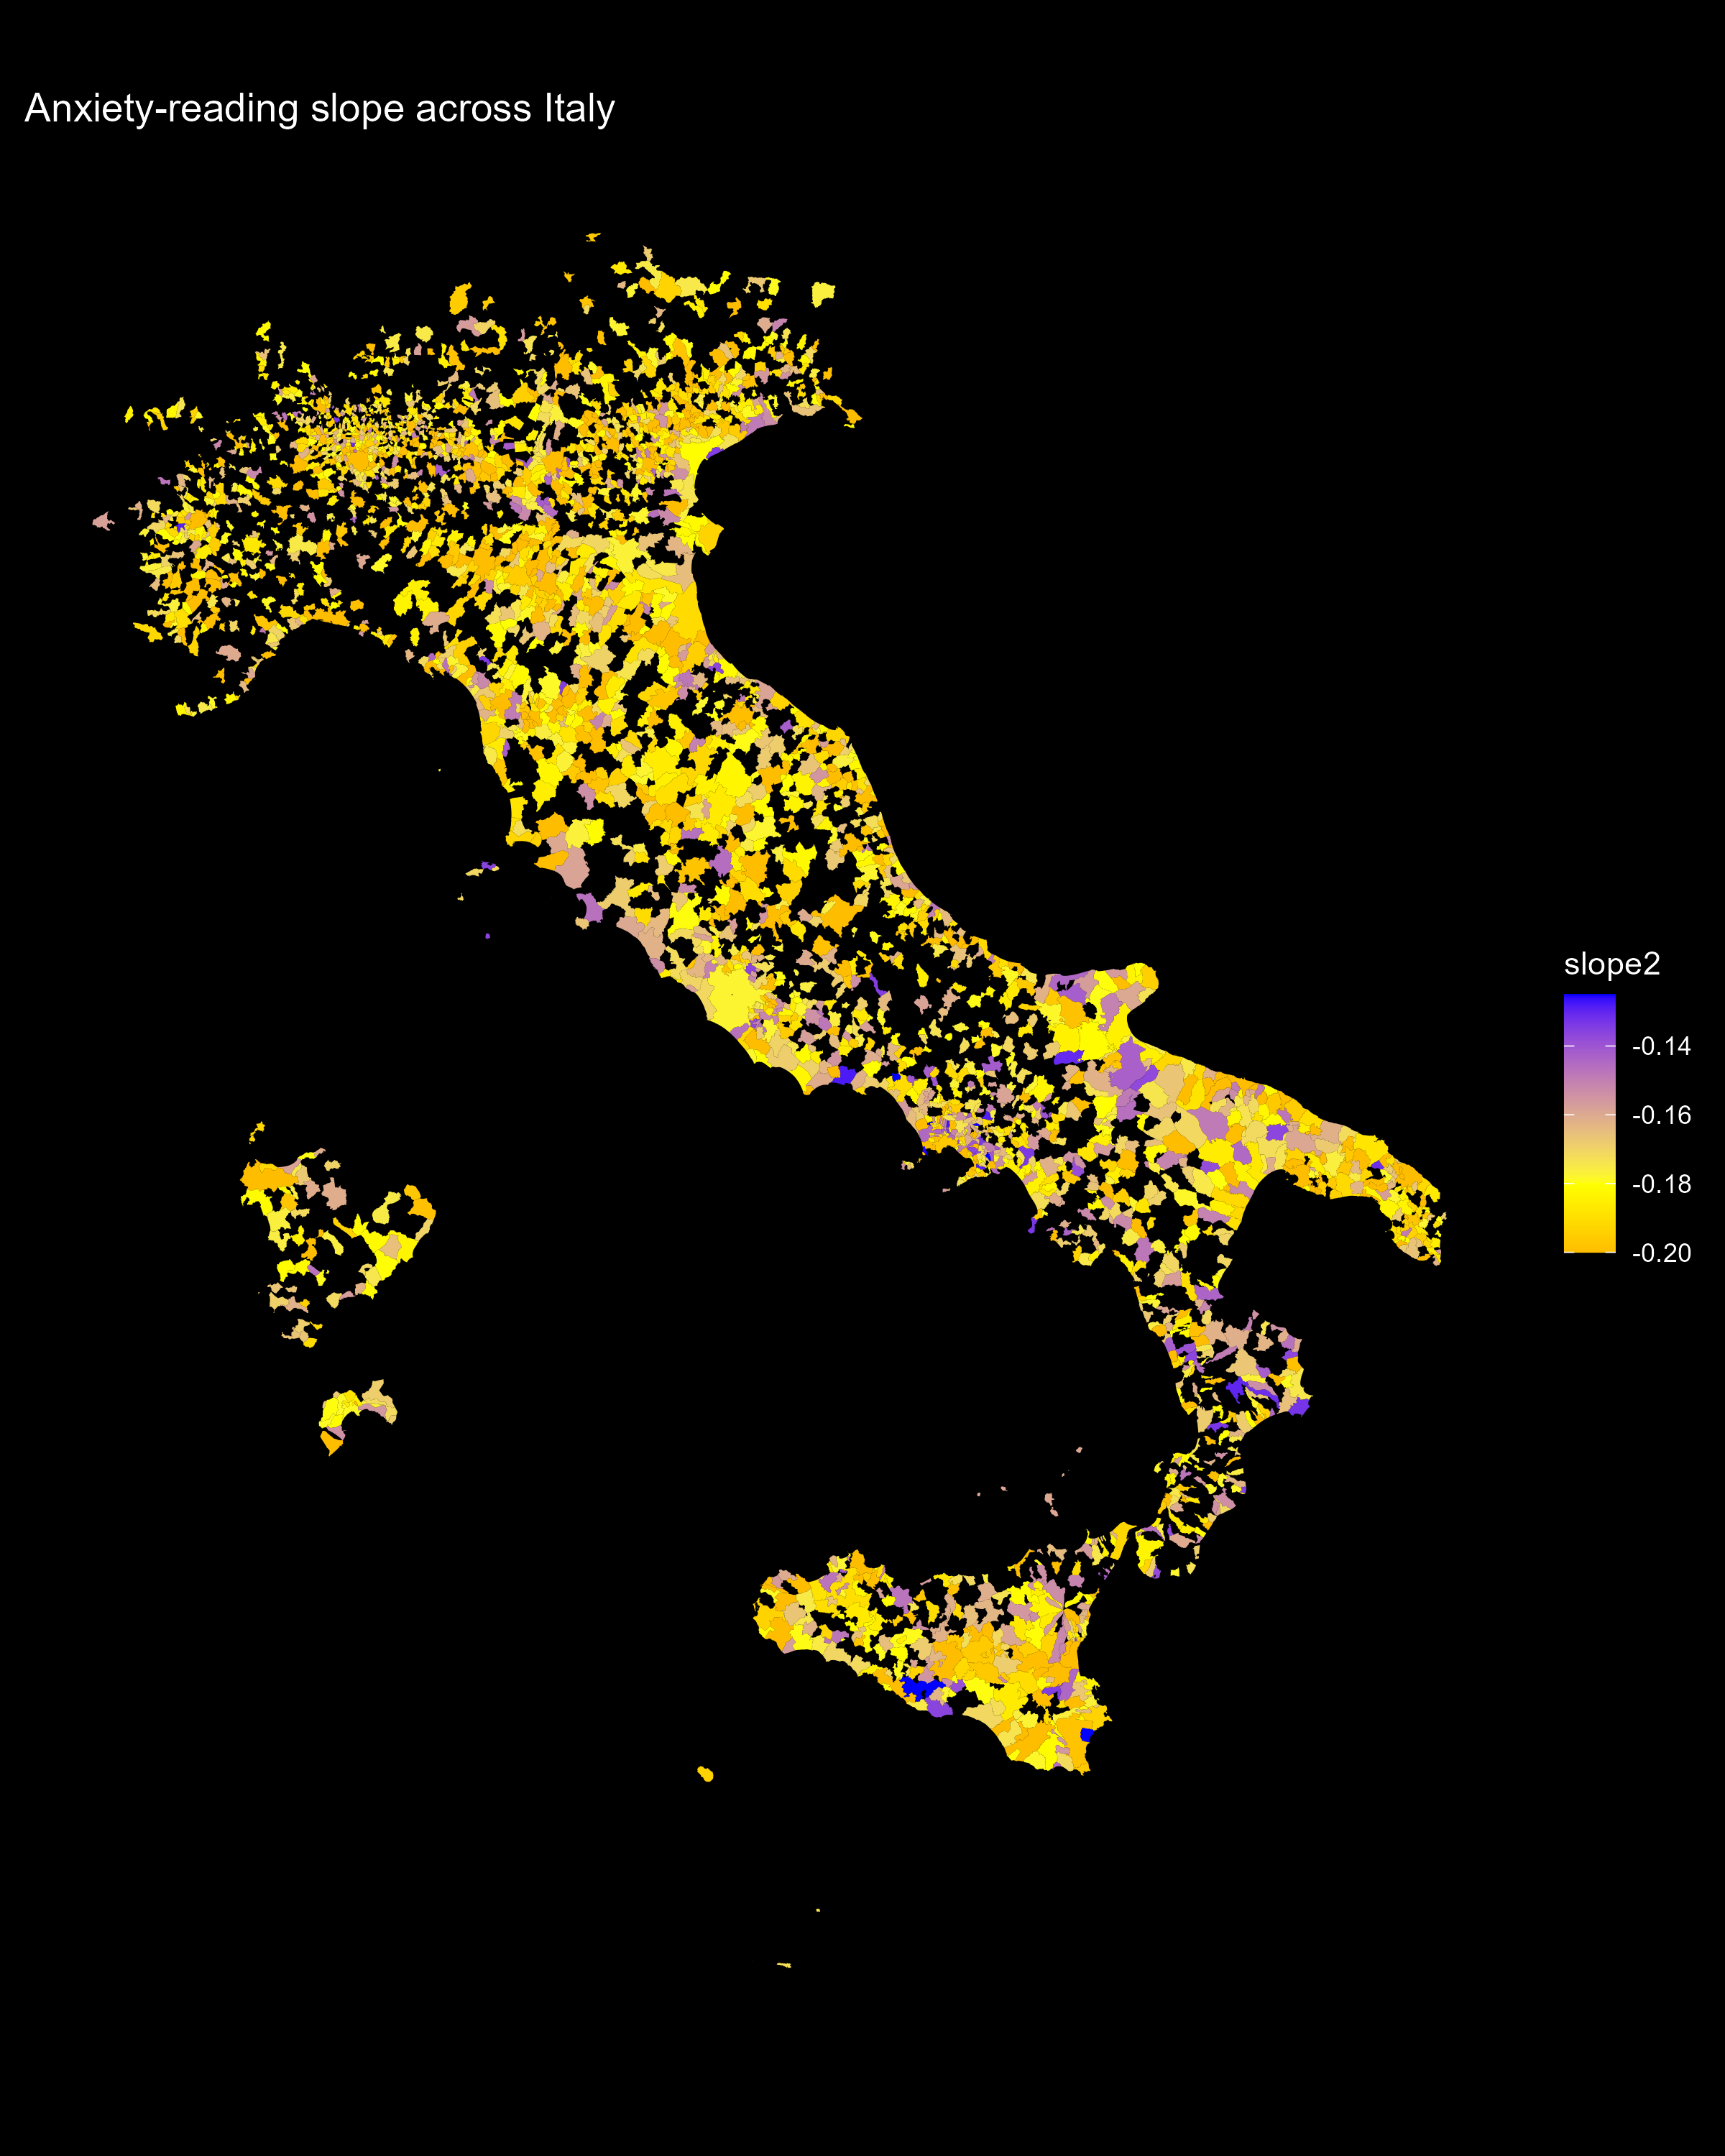
Correlates
THANK YOU!
References

IBT colloquium 17/09/2025
Social, emotional, and behavioral skills